Risk Notes
Page Contents
Risk Heat Map
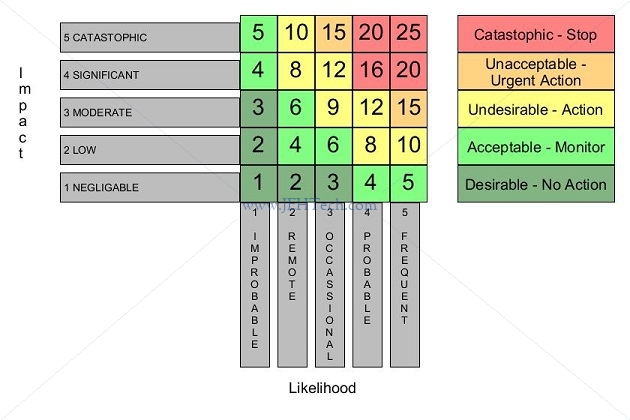
Horizontal axis is the likelihood that the event will happen. Vertical access is the impact that a failure will have. The risk is the likelihood * impact.
Provides a simple, visual picture of risks to increase focus on risk appetite & tolerance.
The heat map can be a efficient summary of a projects risk list or risk register.
Questions to consider when implementing a Risk Heat Map:
- How much risk are we willing to accept?
- What constitutes a material risk to our company?
- What is the range of acceptable variance from our key performance and operating metrics?
- How will we define our terms to evaluate the likelihood of risk events and the impact that they might have on our business, so that we can map our potential risk events to our heat map?
Risk Burndown
Risk burndown chats shows the trend in the risk score for a project.
Early stages of a project should focus on de-risking activities and this chart helps to visualise the success and progress of those activities.
Provide governance insight.
The risk metrics can be created from a risk list, which is often summarised using a risk heat map.
Risk List (Register)
Risk Lists, aka Risk Registers are a list of the risks current faced by a team. It's called a "Risk List" in Disciplined Agile and a "Risk Register" in PRINCE.
Simple table as follows, where the scores are as described for the risk heat map.
| ID | Risk | Liklihood Score | Impact Score | Magnitude | Owner | Status | Date Identified | Days active |
|---|---|---|---|---|---|---|---|---|
| 1 | A description | 2 | 5 | 10 | JH | Open/Waiting/Closed | dd/mm/yyy | 13 |
| 2 | ... |