Python Pandas Notes
Page Contents
References
Introduction
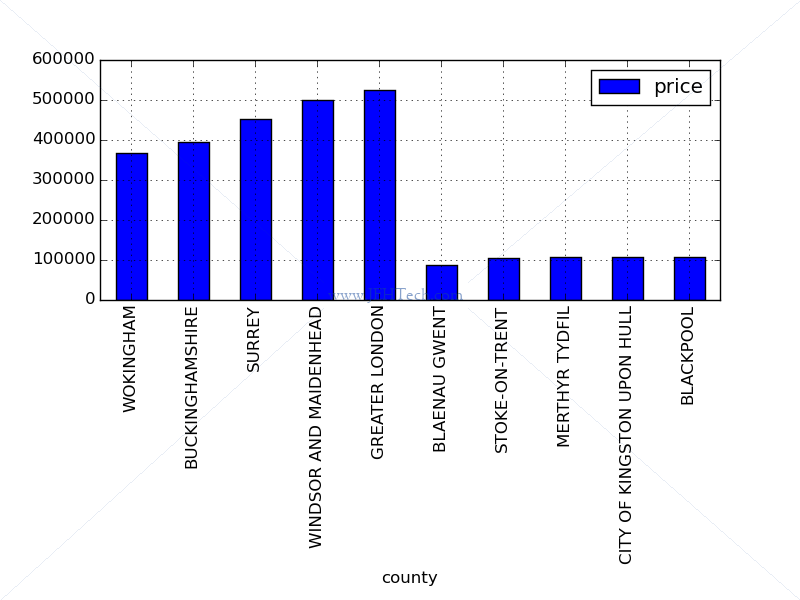
A funny little example to see how average house prices differ in the UK using Pandas. The example uses data from the UK government's open data website on the residential property sales in England and Wales that are lodged with Land Registry for registration in 2014, to compute the 5 most expensive and least-expensive places to buy a home (on average)...
A small motivating example...
import urllib2
import os
import pandas

#
# WARNING: File is about 150MB!!
# See: http://data.gov.uk/dataset/land-registry-monthly-price-paid-data
print "Downloading data from WWW. Reading into Dataframe..."
DATA_FILE = ('http://'
             'prod.publicdata.landregistry.gov.uk.s3-website-eu-west-1.amazonaws.com/'
             'price-paid-data/pp-2014.csv')
df = pandas.read_csv(
        DATA_FILE,
        index_col=False, # Make sure first column is NOT treated as index!
        names=[ "code", "price", "date", "postcode", "f1", "f2", "f3",
                "address1", "address2", "address3", "address4", "address5",
                "address6", "county", "f4"] )

# Possibly don't really need to filter as price is the only numeric column
# and pandas seems to ignore the non-numerics quite sensibly.
df2            = df.ix[:,["county", "price"]]
grouped        = df2.groupby("county", sort=True)
mean_prices_df = grouped.mean().sort(columns=["price"])

fig, ax = pl.subplots()

print "\nThe 5 most expensive counties in the UK, 2014 are..."
least = mean_prices_df.tail(5)
print least

print "\nThe 5 least expensive counties in the UK, 2014 are..."
most = mean_prices_df.head(5)
print most

pandas.concat([least,most]).plot(ax = ax, kind='bar')
pl.subplots_adjust(bottom=.5)
ax.grid()
fig.savefig(r'pandas_landreg.png')
This will output the following:
Read Data In From Files
From Tab Delimited File
If the data doesn't have column headings...
df = pandas.read_table('filename', header=None, index_col=0)
The parameter header=None tells pandas there are no column headers.
The parameter index_col=0 tells pandas to use column 0 in the file as the index.
You can use other paramters like names=['col1', ...] to give columns specific names. To set the index name use df.index.name = 'a_name'.
From A CSV File
df = pandas.read_csv(filename, header=None, skipinitialspace=True)
The field header, if left out, will default to trying to infer if there is a header. None means
no header and an integer or list of integers gives the row(s) which contain the header
From Microsoft Excel File
Also really easy:
df = pandas.read_excel('filename', sheetname='string or int-index', index_col=0, skiprows=0, names=['col1_name', ...])
The filename can be a filename on your local PC or a URL. It can also be an xlrd object.
Massage Data Formats
Rename The Index Column
Often when reading in a file, having specified the index column, I want to give it a name. Done like so:
df.index.name = 'string-name'
Get The Date Formats In Order
DATETIME_FORMAT = '%Y-%m-%d %H:%M:%S'
df.datetime_column = pd.to_datetime(dfAssayInf.datetime_column, format=DATETIME_FORMAT, errors='raise')
Manually Create Data Frame
To create an empty data frame:
df = pd.DataFrame(index=range(numRows),columns=range(numCols))
Cleaning Data
Renaming Columns
You can reset all the column names at once by writing into to df.columns attribute.
To selectively rename columns it is easier to use
df.rename(columns = {col1_name : col1_new_name, ...}).
Create/Modify Column Based On A Column
df['col-name'] = df.apply(a_function, axis=1)
The parameter axis=1 means applying the function to columns,
i.e., each row will be iterated over and passed as a Series object
to the function a_function.
Create Empty Column
df.newNanCol = np.nan
df.newStringCol = ""
# And so on...
Remove Rows Where No Column Has A Value From A Set
df[df.isin([list, of, values]).any(axis=1)]
Select Columns Of Certain Types
To return a dataframe with only columns of certain types or excluding certain types use:
df.select_dtypes(include=[...], exclude=[...])
You can select numeric types using 'numpy.number', strings (and objects) using 'object', datetimes using 'datetime' and much more (see the doc link).
Trim All Strings
df_obj = df.select_dtypes(['object'])
df[df_obj.columns] = df_obj.apply(lambda x: x.str.strip())
Row Operations
Iterate Through Rows
df.iterrows() -> (index_value, series)
The function iterrows() returns a tuple for every row in the data frame. The
first tuple member is the index entry for the row and the second is a Series object
representing the columns in that row.
Filter By Set Membership
df[df['col-name'].isin([1, 2, 3, ...])]
Dates & Time
Parse A String Into A Date
pd.to_datetime('10/08/2011', format='%d/%m/%Y')
Creating Date Ranges
pd.date_range(pd.to_datetime('10/08/2011', format='%d/%m/%Y'), periods=10)
The above creates a range of dates from "10/08/2011" to "2011-08-19". What periods
means is defined by another optional parameter freq.
You'll note that instead of just passing the string "10/08/2011" straight to date_range(),
I wrap it inside a to_datetime() call. The reason for this was that, dispite my locale settings
being correct, date_range() seemed to be interpretting the string as month-day-year, even when
I set tz='gmt'. So to be explicit, remove ambiguity (the code becomes more self documenting) and
to make sure I don't trip myself up on these issues, I tend to do this.
Plotting
To plot two columns from a multi-column dataframe:
df.plot(x='Column1_Label', y='Column2_Label', kind='line', marker='o', title="X vs Y Plot")
Rough and ready notes
Pandas workhouses: Series and DataFrame

INTRO TO DATA STRUCTS
=====================

Series:
-------
Series: 1D array-like object. Array of NumPy data type plus labels (the index)

Series_obj = Series([...data...], index=[...labels...])
Series_obj.value = NumPy array containing data from the series object
Series_obj.index = Array of indicies/labels for the series object

Index can be anything... numbers, strings, whatever.

Index a Series like NumPy arrays except use whatever type the index is of.
Eg Series_obj['aString'] or Series_obj[['a','b','c']] or Series_obj[123]

NumPy array operations, preserve the index-value link I.e, can treat Series
like a NumPy array with a special intellegent index.

Can create from dict. Dict keys become index and key values become the data.

NaN indicate missing data in series. Use pd.isnull() or pd.notnull() to detect

Series automatically align differently indexed data in arithmetic operations.
This matching labels have operator applied and labels not in both Series
become NaN in the resulting Series.

Series and index have 'name' attribute.

Can alter index in place. eg Series_obj.index = [...labels...]


DataFrame:
----------

DataFrame represents a tabular data structure containing an ordered
collection of columns, of possibly different value types.

Has both row and col index. Like a dict of Series, all sharing same index

** DataFrame from dict of lists **
DataFrame from dict of equal-length lists:
	data = {'state': ['Ohio', 'Ohio', 'Ohio', 'Nevada', 'Nevada'],
	        'year': [2000, 2001, 2002, 2001, 2002],
	        'pop': [1.5, 1.7, 3.6, 2.4, 2.9]}
	frame = DataFrame(data)
pop, state, year become the columns

Can override the *order* of cols with DataFrame(data, columns= [...col labels...])
where col labels are the same as before, just sepcified in order to appear in tbl

If spec a column not in data then it is added as Series of NaN's

Get Series from dataframe like a dict or obj:
	frame.state //or
	frame['state']

Cols can be modified by assignment.
	Assign scalar sets all values to scalar.
	Can assign NumPy array of same length as DataFrame #rows.
	Assign Series means Series will be conformed to #rows inserting NaNs where
		needed (where labels/index don't match)

Assign to non-existing column creates column
del keyword removes columns (as in del frame2['eastern'])

**DataFrame From Dict of Dicts**
Outer dict keys become DataFrame columns
Inner dict keys become row indicies/labels (they are unioned and sorted)
Innder dict values become data (missing labels become NaNs)

**DataFram From Dict of Series **
Outder dict keys become columns
Series become the column values


Iterate over rows:
for row_idx, row in df.iterrows():
   print row_idx, type(row)


Index Objects
-------------
Index objects hold the axis labels and other metadata (like the axis name or
names). Index objects are IMMUTABLE.

Index is array like and also fixed-sized-set like.
e.g. can do "blah in frame.index"

Index methods include append, diff, intersection, untion, isin, delete, drop,
insert, is_monotonic, is_unique


ESSENTIAL FUNCTIONALITY
=======================

Reindex
-------
Create new series with data conformed to new index. Can use to re-arrange order
of current indicies and add new ones as NaNs (or fillValue=xxxx).
	eg obj.reindex(['a', 'b', 'c', 'd', 'e'], fill_value=0)

Can interpolate values using method='ffill' (carries values forward) or 'bfill'
(carries values backwards)


For DataFrame reindex operates on either rows, cols, or both!
	frame2 = frame.reindex(['a', 'b', 'c', 'd']) // does ROWS by default
	frame.reindex(columns=[....]) // does COLUMNS

Dropping axis entries
---------------------
newser = Series.drop('x') drops row with label 'x' from the series. returns new obj
or newser = Series.drop(['x', 'y'])


newdf = DataFrame.drop([...], axis=?) - drops row/col,
                                        axis==1 is col, axis==0 is row (default
                                        is axis==0)


Index, Selection, Filtering
---------------------------

Use series like NumPy arrays. BUT RANGE IS END-INCLUSIVE FOR LABELS (but
apparently not for numerical indexing??)!!

Indexing for a DataFrame retreives one or more COLUMNS when using labels but
using range or boolean array it selects ROWS.

Can also index with another DataFrame Boolean.

Mostly direct DF indexing is to do with columns.

To index ROWS us the **.ix indexing field**
	It is a powerful indexer and lets you select a subset of the rows and columns
	from a DataFrame with NumPy-like notation plus axis labels

DataFrame_obj.ix[row-specifier1, col-specifier] or
DataFrame_obj.ix[row-range, col-range]
The specifiers can be labels, indicies etc as per usual array selection/filter


Indexing options with DataFrame (most exist for Series too!)
Type Notes
obj[val]           Select single column or sequence of columns from the DataFrame.
                   Special case conveniences:
                       boolean array sample length as index (filter rows),
                       slice (slice rows), or
                       boolean DataFrame (set values based on some criterion).
                   can use df.map() to generate more complex criteria0

obj.ix[val]        Selects single row of subset of rows from the DataFrame.
obj.ix[:, val]     Selects single column of subset of columns.
obj.ix[val1, val2] Select both rows and columns.
reindex            method Conform one or more axes to new indexes.
xs                 method Select single row or column as a Series by label.
icol, irow         methods Select single column or row, respectively, as a Series by integer location.
get_value, set_value methods Select single value by row and column label.
loc  - used on index values - LABEL BASED indexing.
       Start AND stop bound included in slices
       Accepts single labels, lists of labels, ranges of labels
       Use:
          series.loc[lbl]
          df.loc[row-lbl-spec, col-lbl-spec] where spec is single lbl, list
             of lbls, lbl range, or array of booleans.
          df.loc[row-lbl] for cross section - row row-lbl for all columns.

       TO BE PREFERED OVER CHAINED INDEXING.
       ie, for MultiIndex use df.loc[:,("a","b")] not df["a"]["b"]
       ESPECIALLY for setting!

iloc - integer positions (i.e. like array index, 0 based)
       standard array indexing, i.e scalar, fancy, ranges, bools
       can SET using iloc
       Use:
          df.iloc[idx] - gives rows for all cols
          df.iloc[row-idx, col-idx]
       Out-of-range slices handled gracefully.
.at/iat - fast scalar value get/set
sample() for random samples
isin() - returns bool vect, true wherever the element is in passed list. With
         df can also match vertain values with certain cols by passing in
         a dict.
         Eg from Pandas docu:
            values = { 'colA': [...], 'colB': [...], ... }
            row_mask = df.isin(values).all(1)
            df[row_mask]
where() - return series with same shape as orig
          is s[s>0] v.s. s.where(s > 0)
          Same for df, also accepts value for where condition would be false
          to fill in with. By default returns copy by has inplace arg.
mask()  - inverse of where.

get_loc - gets integer positions


Arithmetic
----------

When adding together objects, if any index pairs are not the same, the
respective index in the result will be the set union operation of the index
pairs between each obj. All labels in one and not the other become NaNs!

Can set fill values instead of NaN: eg. df1.add(df2, fill_value=0) - will make
the value not in the other set equal to 0 for the operation.

Arithmetic between DataFrame and Series is well-defined via broadcasting.

Ops include add, mul, div, sub


Sorting
-------
sort_index == method to sort lexicographically by row or column index

series_obj.sort_index()
dataframe_obj.sort_index(axis=..., ascending=t/f) 0 for rows, 1 for cols

order == sort by values (not index) -- only series
series_obj.order()

to sort by value for data frame use sort_index(... by=[cols-to-value-sort])

Duplicate values in index
-------------------------
Duplicate values possible.
is_unique() tells you whether axis labels are mutually exclusive

If index by duplicate value all values with the matching index are returned

Applies to Series and DataFrames

Statistics
----------
df.sum(axis=0,1). 0 is default to sum cols, 1 to sum rows.

skipna=t/f option to skip NaNs... true by default

count()      Number of non-NA values
describe()   Compute set of summary statistics for Series or each DataFrame column
min(), max() Compute minimum and maximum values
argmin(),    argmax Compute index locations (integers) at which minimum or maximum value obtained, respectively
idxmin(),    idxmax Compute index values at which minimum or maximum value obtained, respectively
quantile()   Compute sample quantile ranging from 0 to 1
sum()        Sum of values
mean()       Mean of values
median()     Arithmetic median (50% quantile) of values
mad()        Mean absolute deviation from mean value
var()        Sample variance of values
std()        Sample standard deviation of values
skew()       Sample skewness (3rd moment) of values
kurt()       Sample kurtosis (4th moment) of values
cumsum()     Cumulative sum of values
cummin(),    cummax Cumulative minimum or maximum of values, respectively
cumprod()    Cumulative product of values
diff()       Compute 1st arithmetic difference (useful for time series)
pct_change() Compute percent changes


Correlation and Covariance
--------------------------
The corr method of Series computes the correlation of the overlapping, non-NA,
aligned-by-index values in two Series. cov computes the covariance:
	series_obj1.corr(series_obj2), same as
	dframe.col1.corr(dframe.col2)


dframe.corr/cov == full correlation or covariance matrix as a DataFrame

Unique Values, Value Counts, and Membership
-------------------------------------------

series_obj.unique() return series data as array with only unique values
series_obj.value_counts() return series containing index as values and values as
	# occurences of the index values.

series_obj.is_in([...set...]) returns series mask t/f for each value if in set.

Handling Missing Data
---------------------
all of the descriptive statistics on pandas objects exclude missing data by default

pandas uses the floating point value NaN (Not a Number) to represent missing data
The built-in Python None value is also treated as NA in object arrays

NA handling methods:
	dropna    Filter axis labels based on whether values for each label have
	          missing data, with varying thresholds for how much missing data to
	          tolerate.
	fillna    Fill in missing data with some value or using an interpolation
	          method such as 'ffill' or 'bfill'.
	isnull    Return like-type object containing boolean values indicating which
	          values are missing / NA.
	notnull   Negation of isnull.

eg
	df.fillna(0) or
	df.fillna({1: 0.5, 3: -1}) # Fill diff NAs in different cols with different vals

Most return a new object but you can use 'inplace=True' to do it inplace on
the curretn df

The same interpolation methods available for reindexing can be used for fillna()

Hierarchical Indexing
---------------------
Enables you to have multiple (two or more) index levels on an axis: Series with
a MultiIndex as its index.


PARTIAL INDEX outer or inner index of hierachy:
ser_obj['outer_label'] == returns all the inner labels and their data associated
                       with the outer label

ser_obj[:'inner'] == returns all the inner labels matching 'inner' returning the values labeled by outer
^^^^
This doesn't seem to work
Use df.xs()


Can use ranges/slices etc as normal in this form of indexing like the normal array ops

ser_obj.unstack() == produces a dataframe with inner as the columns and outer as the rows
ser_obj.stack()   == does the inverse of unstack

With a DataFrame, either axis can have a hierarchical index.

In [270]: frame = DataFrame( np.arange(12).reshape((4, 3)),
.....:                       index=[['a', 'a', 'b', 'b'], [1, 2, 1, 2]],
.....:                       columns=[['Ohio', 'Ohio', 'Colorado'],
.....:                       ['Green', 'Red', 'Green']])
In [271]: frame
Out[271]:
       Ohio      Colorado
     Green Red      Green
a 1      0   1          2
  2      3   4          5
b 1      6   7          8
  2      9  10         11

To re-order the hierachy levels use frame.swaplevel('key1', 'key2').
To sort the data by a particular level use frame.sortlevel(1)

Stats functions can also pick a level: frame.sum(level='key2')


Clean, Transform, Merge, Reshape
=================================================

Overview
---------
Data contained in pandas objects can be combined together in a number of built-in
ways:
+ pandas.merge connects rows in DataFrames based on one or more keys. Implements database
join operations.
+ pandas.concat glues or stacks together objects along an axis.
+ combine_first instance method enables splicing together overlapping data to fill
in missing values in one object with values from another.

Merging on column(s)
---------------------
pd.merge(df3, df4, on='key', how='inner|outer|left|right')
defaul 'how' is "inner"
if no shared key can use options 'left_on='lkey', right_on='rkey''
use 'key=["key1",..., "keyN"]' to join on multiple keys
use suffixes=(tuple of key suffixes)' to label "on" keys from different frames differently

WARNING: When joining columns-on-columns, the indexes on the passed Data-
Frame objects are discarded

*merge function arguments*
Argument		Description
left 			DataFrame to be merged on the left side
right 		DataFrame to be merged on the right side
how 			One of 'inner', 'outer', 'left' or 'right'. 'inner' by default
on 			Column names to join on. Must be found in both DataFrame objects.
				If not specified and no other join keys given, will use the
				intersection of the column names in left and right as the join keys
left_on 		Columns in left DataFrame to use as join keys
right_on 	Analogous to left_on for left DataFrame
left_index 	Use row index in left as its join key (or keys, if a MultiIndex)
right_index	Analogous to left_index
sort 			Sort merged data lexicographically by join keys; True by default.
				Disable to get better performance in some cases on large datasets
suffixes 	Tuple of string values to append to column names in case of overlap;
				defaults to ('_x', '_y'). For example, if 'data' in both DataFrame
				objects, would appear as 'data_x' and 'data_y' in result
copy 			If False, avoid copying data into resulting data structure in some
				exceptional cases. By default always copies

Merging on index
----------------
pass left_index=True or right_index=True (or both) to indicate that the
index should be used as the merge key

Files and IO
============

Get from DB
------------
import pandas.io.sql as sql
sql.read_frame('select * from test', con)

Where 'con' is the Python DB connection object.


R style pipes in Python
=========================
http://stackoverflow.com/questions/28252585/functional-pipes-in-python-like-from-dplyr